Know what to change today
A readiness signal that explains whether to push, maintain, reduce, swap, or recover.
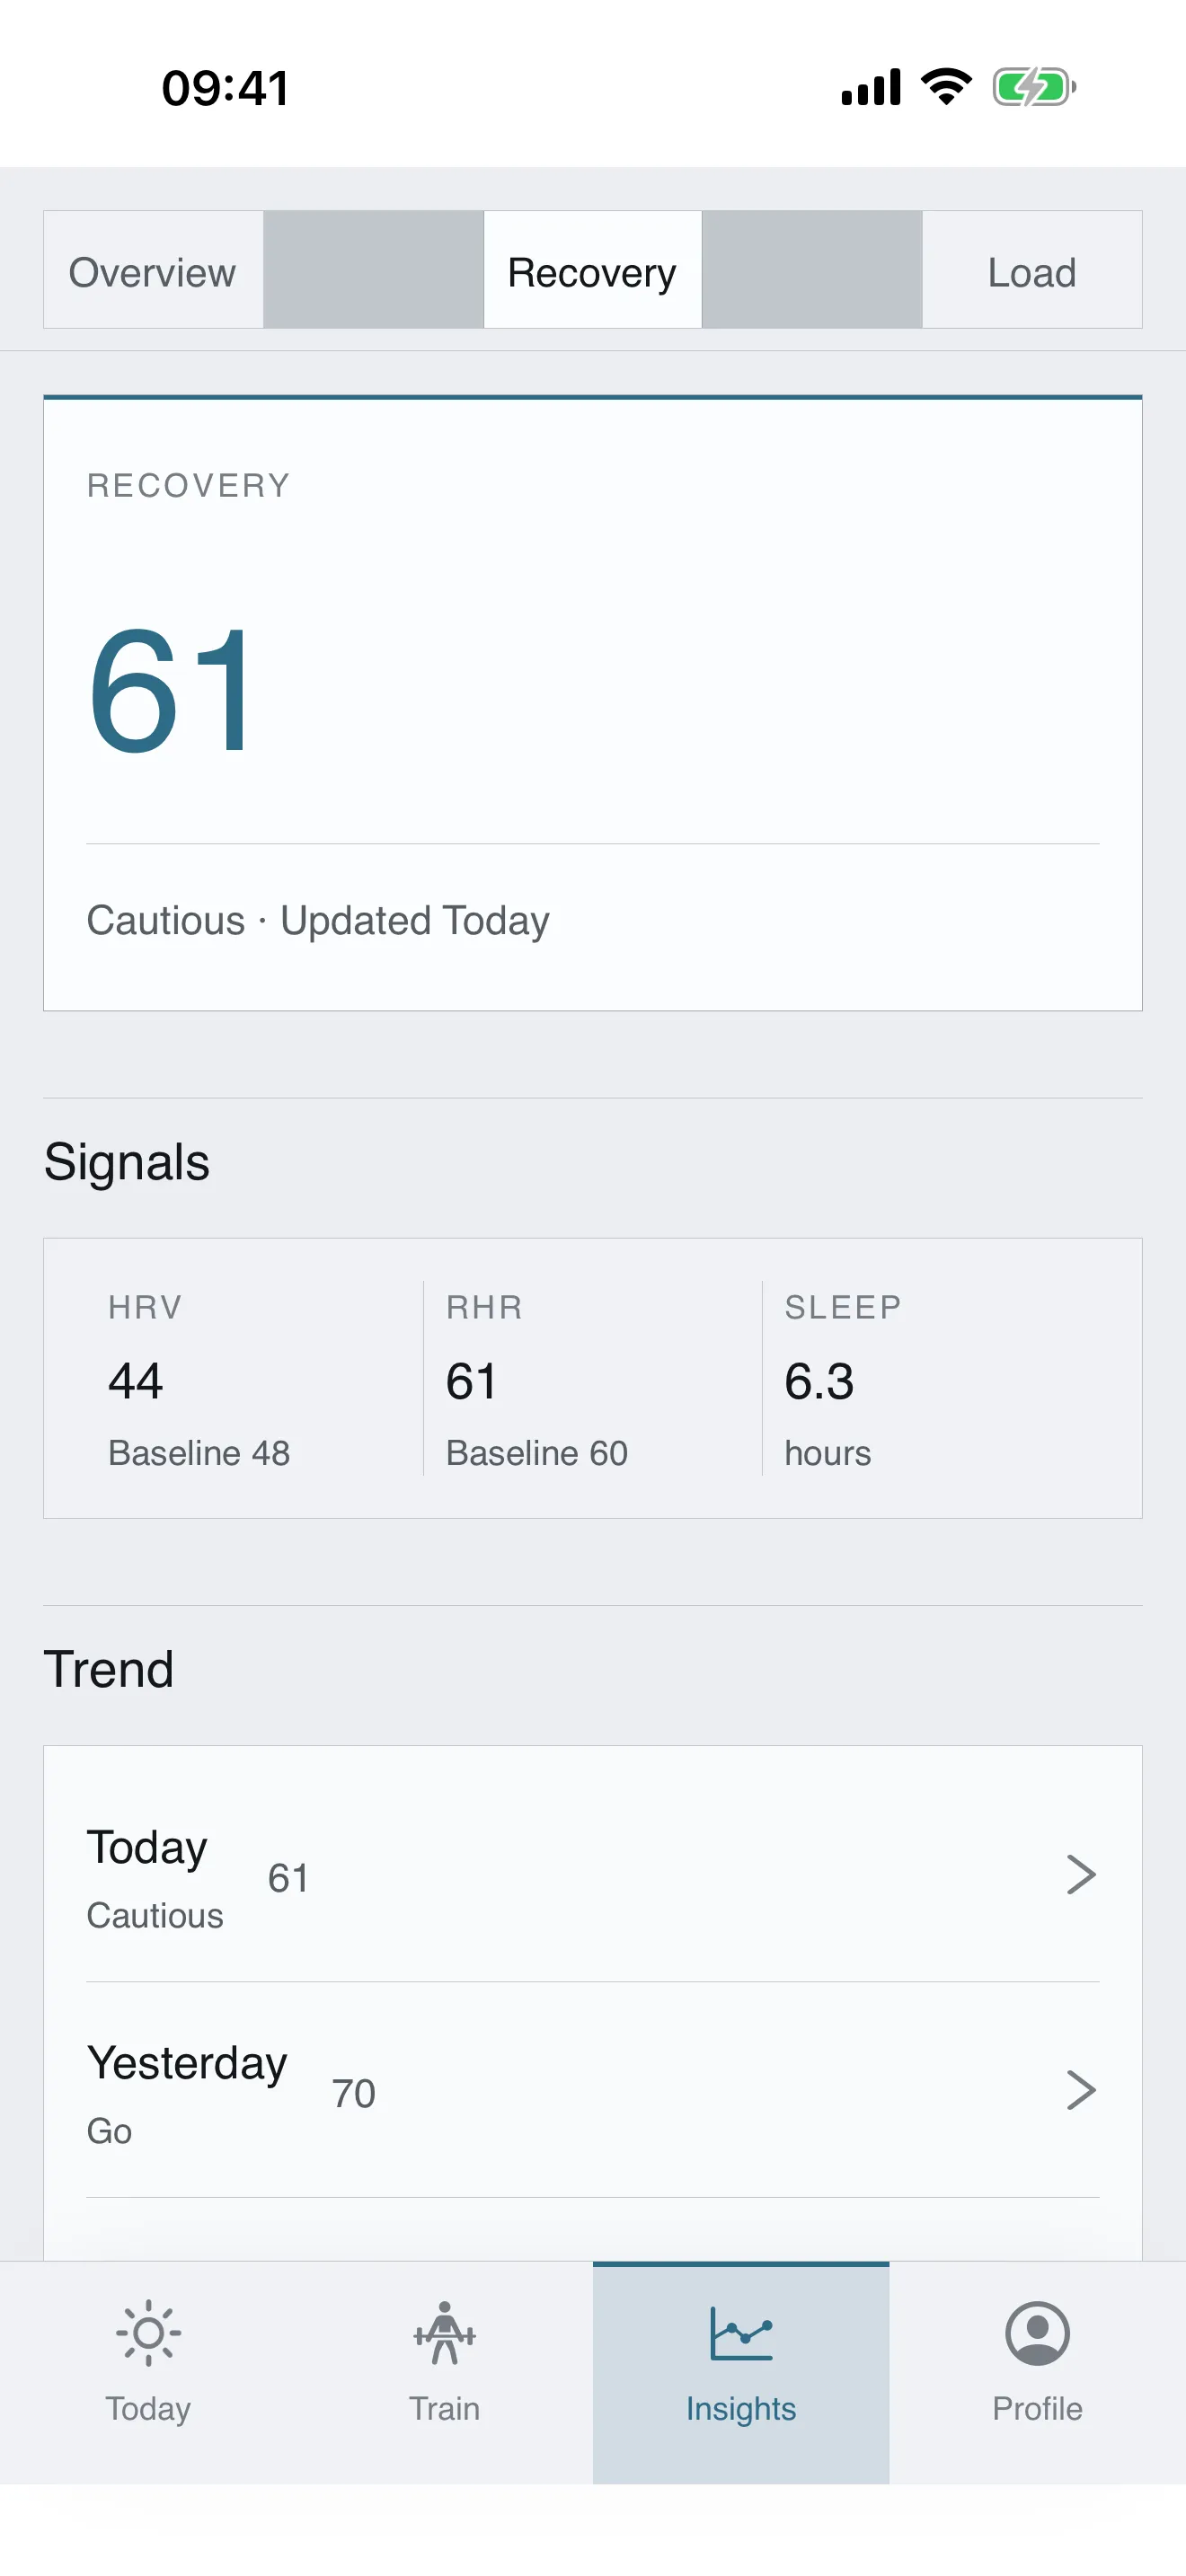
How it works
Every morning, before you pick up a barbell or lace up your shoes, Tuwa has already done the analysis. While you slept, it pulled physiological data from Apple HealthKit — your heart rate variability, resting heart rate, sleep duration, body temperature trend, and VO2 Max estimate — and combined that with your morning wellness check-in, where you rate your soreness, energy levels, and stress. These inputs feed a readiness signal that helps frame the day's training decision.
That number is useful on its own, but it gets more valuable when paired with plain-language reasoning factors. Tuwa doesn't just tell you that your readiness is 62 — it tells you that your HRV is tracking 8% below your recent baseline, your sleep was cut short, but your resting heart rate is normal. You understand not just the score, but why.
Three zones, clear guidance
Recovery scores map to three zones, each with concrete training implications. Green means the planned session is reasonable if warmups confirm it. Yellow means train with guardrails: trim volume and keep RPE capped. Red means recovery should be on the table: light movement, mobility work, or rest. No guessing, no willpower battles with yourself. The signal makes the next choice clearer.
Data from any device you already own
Tuwa works with whatever hardware you already wear. Apple Watch is the most common source, but Whoop, Oura, Garmin, and any other device that writes HRV and sleep data to Apple HealthKit feeds directly into the scoring pipeline. You're not locked into a new wearable ecosystem — Tuwa meets you where you are.
A baseline that's yours, not the population's
HRV numbers vary enormously between individuals — an athlete with a resting HRV of 45 ms isn't worse than one with 80 ms, they're just different. What matters is whether your HRV is above or below your own recent trend. Tuwa calculates that trend using an averaging method that gives more weight to recent days than older ones. Instead of being thrown off by a single anomalous reading, your baseline evolves naturally as your fitness and recovery patterns shift over weeks and months.
The science behind it
Heart rate variability is the variation in time between consecutive heartbeats, measured in milliseconds. A perfectly metronomic heartbeat — every interval exactly the same — is actually a sign of stress. Healthy hearts show subtle beat-to-beat variation because they're responding to signals from the autonomic nervous system, which balances the sympathetic (fight-or-flight) and parasympathetic (rest-and-digest) branches.
When you're well-recovered, parasympathetic activity is dominant and HRV is higher. When you're stressed, fatigued, or fighting off illness, sympathetic tone increases and HRV drops. This is why HRV has become one of the most researched biomarkers in sports science over the past two decades — it's a window into your nervous system's current state.
But HRV is also noisy. A poor night's sleep, a glass of wine, an unusually early alarm — these all affect a single measurement. Comparing your Monday reading to your Sunday reading in isolation is misleading. The signal emerges over time, which is why Tuwa tracks your personal trend rather than individual data points. The chart below illustrates how each data source contributes to your composite readiness score.
What makes up your recovery score
Start coaching yourself with confidence
Download Tuwa to plan, log, adapt, and review your strength training in one place.